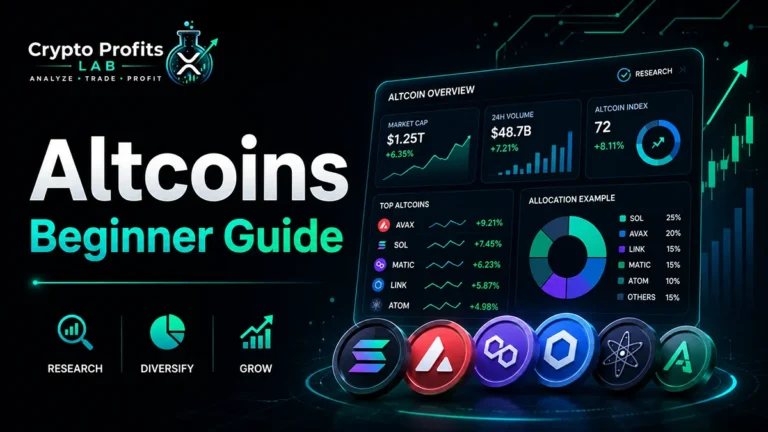
Crypto Charts for Beginners: A Simple Guide
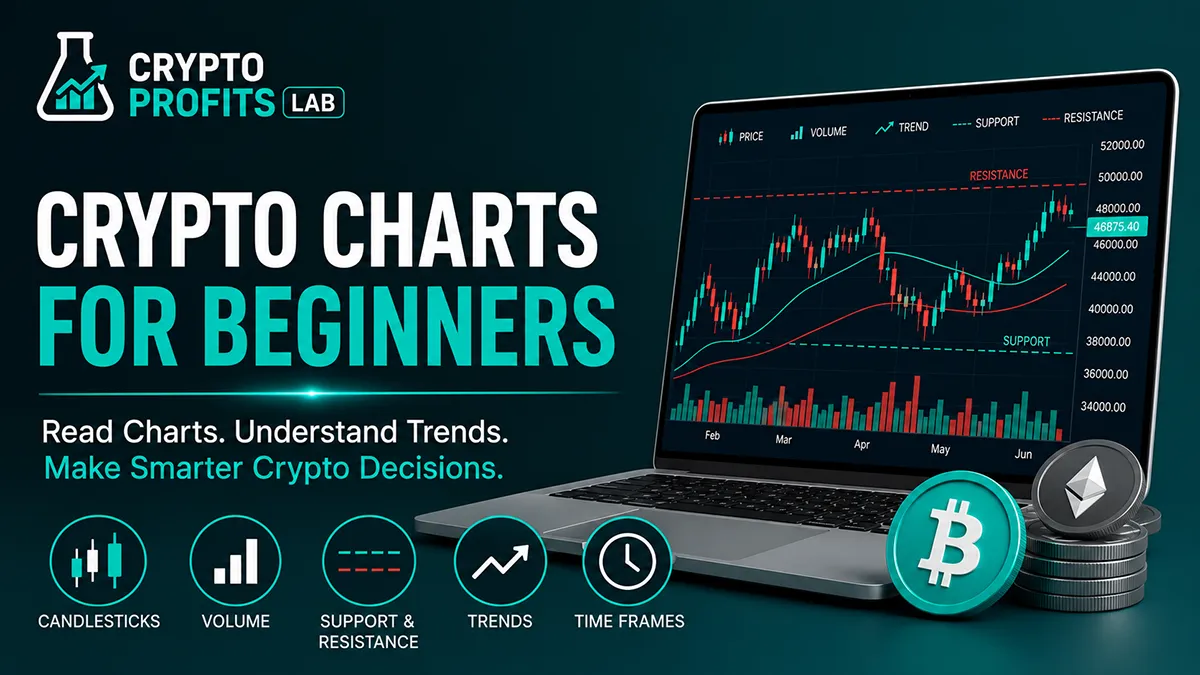
If you are new to digital assets, crypto charts for beginners can look confusing at first. Red candles, green candles, time frames, moving averages, volume bars, support levels, and resistance zones can make a simple price chart feel like a foreign language.
The good news is that you do not need to become a professional trader to understand the basics. You only need to learn what the main chart elements mean, how to avoid common mistakes, and how charts fit into a safer crypto plan.
Crypto charts for beginners are useful because they help you see price history, momentum, volatility, and possible areas where buyers or sellers have been active. Charts do not predict the future with certainty, but they can help you make more informed decisions instead of buying or selling only because of emotion.
Before learning crypto charts for beginners, it helps to understand what is cryptocurrency, crypto volatility, and market cap crypto. Charts are more useful when you understand the asset, the market cycle, and the risks behind the price.
This guide explains crypto charts for beginners in plain English, including candlesticks, volume, support, resistance, time frames, moving averages, trendlines, and common mistakes to avoid.
What Are Crypto Charts?
Crypto charts are visual tools that show how a cryptocurrency’s price has changed over time. A chart can show Bitcoin over one day, Ethereum over one year, or a small altcoin over several minutes.
Most crypto charts display:
- Price movement
- Time frame
- Trading volume
- Candlesticks or line movement
- Highs and lows
- Support and resistance areas
- Indicators such as moving averages
- Market momentum
Crypto charts for beginners are not magic prediction tools. They are historical maps. They show what has already happened and help you interpret possible patterns.
For example, if Bitcoin has repeatedly bounced near the same price level, traders may call that area support. If Ethereum has repeatedly failed to move above a certain price, traders may call that resistance.
You can also review Fidelity’s support and resistance guide for a traditional investing explanation of how price and volume are used in chart analysis.
Quick Crypto Chart Overview
| Chart Element | Beginner Meaning |
|---|---|
| Price | Current or historical value of the asset |
| Time frame | The period shown on each candle or chart view |
| Candlestick | A visual block showing open, close, high, and low prices |
| Volume | How much was traded during a period |
| Support | Area where buyers may become more active |
| Resistance | Area where sellers may become more active |
| Trendline | A line used to visualize direction |
| Moving average | A smoothed average of past prices |
| Breakout | Price moves above a key level |
| Breakdown | Price falls below a key level |
Crypto charts for beginners become easier once you stop trying to read everything at once. Start with price, time frame, and volume before adding indicators.
Why Crypto Charts Matter
Crypto charts matter because prices can move quickly. Without a chart, beginners often rely on headlines, social media posts, or emotions. That can lead to buying after a big pump or selling during panic.
Charts can help you:
- See whether price is rising or falling
- Compare short-term and long-term trends
- Identify high-volatility periods
- Spot major price zones
- Understand buying and selling pressure
- Avoid chasing sudden moves
- Plan entries and exits more calmly
- Compare different cryptocurrencies
This does not mean charts guarantee profits. They do not. A chart can show risk, but it cannot remove risk.
Crypto charts for beginners should be used with other tools, including basic research, risk management, exchange safety, and wallet security. If you are still learning how trades work, read market order vs limit order crypto.
What Is a Candlestick Chart?
A candlestick chart is one of the most common chart types in crypto. Each candle shows price movement during a selected time period.
A candle usually shows four prices:
| Candle Part | Meaning |
|---|---|
| Open | Price at the start of the time period |
| Close | Price at the end of the time period |
| High | Highest price reached during the period |
| Low | Lowest price reached during the period |
If you are looking at a 1-day chart, each candle represents one day. If you are looking at a 1-hour chart, each candle represents one hour.
A green candle usually means the price closed higher than it opened. A red candle usually means the price closed lower than it opened.
Crypto charts for beginners often start with candles because candles give more information than a simple line chart. A line chart may show the closing price, but a candlestick shows the range and direction of each period.
How to Read Green and Red Candles
Green and red candles show price direction during a selected time frame.
A green candle usually means buyers pushed the price higher during that period. A red candle usually means sellers pushed the price lower.
However, one candle does not tell the full story. A single green candle does not guarantee a bull market, and a single red candle does not guarantee a crash.
Look for context:
- Is the candle large or small?
- Did volume increase?
- Is the candle near support or resistance?
- Is the overall trend up or down?
- Is the market reacting to news?
- Is the coin highly volatile?
Crypto charts for beginners should be read in groups, not one candle at a time. The pattern over many candles matters more than one isolated candle.
What Are Time Frames?
A time frame controls how much time each candle represents.
Common time frames include:
| Time Frame | Common Use |
|---|---|
| 1 minute | Very short-term trading |
| 5 minutes | Fast intraday movement |
| 15 minutes | Short-term trading |
| 1 hour | Intraday trend view |
| 4 hours | Swing trading context |
| 1 day | Daily market trend |
| 1 week | Long-term trend |
| 1 month | Big-picture history |
Beginners often make the mistake of looking only at very short time frames. A 5-minute chart can look dramatic, but it may not matter much in the larger trend.
Crypto charts for beginners should usually start with higher time frames such as the daily or weekly chart. These views help you understand the bigger picture before zooming in.
For example, a coin may look strong on a 15-minute chart but still be in a long-term downtrend on the weekly chart.
What Is Trading Volume?
Trading volume shows how much of a cryptocurrency was traded during a specific period. It is usually displayed as bars below the price chart.
Volume matters because it can show how much activity is behind a price move.
For example:
| Price Move | Volume Clue |
|---|---|
| Price rises with high volume | Buyers may be more active |
| Price rises with low volume | Move may be weaker |
| Price falls with high volume | Selling pressure may be strong |
| Price moves sideways with low volume | Market may be waiting |
Crypto charts for beginners should always include volume. Price without volume can be misleading.
If a small altcoin suddenly rises 30% on very low volume, that move may be easier to reverse. If Bitcoin breaks above a major level with strong volume, traders may take the move more seriously.
What Is Support?
Support is a price area where buyers have previously stepped in and helped stop the price from falling.
Think of support like a floor. It does not always hold, but it can show where buyers may become interested.
Support can form when:
- Buyers believe the price is attractive
- Traders place limit orders near a level
- Long-term holders defend a price zone
- Previous resistance becomes support
- A moving average attracts buyers
Example:
If Ethereum drops near $2,500 several times and bounces, traders may view $2,500 as a support area.
Crypto charts for beginners should treat support as a zone, not an exact number. Markets are messy. Price may dip slightly below support and recover, or it may break through completely.
What Is Resistance?
Resistance is a price area where sellers have previously stepped in and slowed or stopped a price increase.
Think of resistance like a ceiling. It does not always stop price forever, but it can show where selling pressure may appear.
Resistance can form when:
- Traders take profits
- Previous buyers try to break even
- Short-term sellers become active
- A major round number attracts attention
- A moving average blocks upward movement
Example:
If Bitcoin rises near $70,000 several times and fails to break higher, traders may view that area as resistance.
Crypto charts for beginners should remember that resistance can break. When price moves above resistance with strong volume, some traders call it a breakout.
Support vs Resistance
Support and resistance are two of the most common ideas in chart reading.
| Concept | Simple Meaning | Beginner Use |
|---|---|---|
| Support | Possible buying area | Helps avoid panic selling near lows |
| Resistance | Possible selling area | Helps avoid chasing near highs |
| Breakout | Price moves above resistance | May signal strength |
| Breakdown | Price falls below support | May signal weakness |
Crypto charts for beginners become more useful when you stop thinking in exact predictions. Support and resistance are not guarantees. They are areas of interest.
A safer beginner mindset is: “This level matters, so I should watch how price behaves here.”
What Is a Trend?
A trend is the general direction of price movement.
There are three basic trend types:
| Trend Type | Meaning |
|---|---|
| Uptrend | Higher highs and higher lows |
| Downtrend | Lower highs and lower lows |
| Sideways trend | Price moves within a range |
An uptrend means buyers are generally in control. A downtrend means sellers are generally in control. A sideways trend means the market is uncertain or balanced.
Crypto charts for beginners should focus on identifying the trend before making decisions. Buying in an uptrend can be different from buying in a downtrend.
If you are learning market cycles, read bull vs bear market crypto.
What Are Moving Averages?
A moving average smooths out price data to help show the overall trend.
Common moving averages include:
- 20-day moving average
- 50-day moving average
- 100-day moving average
- 200-day moving average
A short moving average reacts faster to price changes. A long moving average moves more slowly and shows broader trend direction.
Beginners often watch the 50-day and 200-day moving averages because they can show whether price is trading above or below important longer-term averages.
Crypto charts for beginners should not rely only on moving averages. They are lagging indicators, which means they are based on past prices. They can help show trend direction, but they do not predict future prices perfectly.
What Is an Order Book?
An order book shows current buy and sell orders on an exchange. It is not the same as a price chart, but it can help explain short-term market activity.
The order book usually includes:
- Buy orders
- Sell orders
- Bid prices
- Ask prices
- Order size
- Spread between bid and ask
If many buyers are waiting at a certain price, that area may act like short-term support. If many sellers are waiting above the current price, that area may act like short-term resistance.
Crypto charts for beginners do not require deep order book analysis, but understanding bids, asks, and spreads can help you avoid poor trade execution.
For more detail, read market order vs limit order crypto.
Line Chart vs Candlestick Chart
A line chart connects closing prices over time. A candlestick chart shows open, high, low, and close prices.
| Chart Type | Best For | Main Limitation |
|---|---|---|
| Line chart | Simple trend view | Less detail |
| Candlestick chart | More complete price action | Can look confusing at first |
| Bar chart | Alternative price display | Less common for beginners |
A line chart can help beginners avoid visual overload. A candlestick chart gives more detail once you are ready.
Crypto charts for beginners do not need to be complicated. If candles feel overwhelming, start with a line chart, then move to candlesticks later.
Common Chart Patterns Beginners See
Some traders watch chart patterns, but beginners should be careful not to overtrust them.
Common patterns include:
- Double top
- Double bottom
- Breakout
- Breakdown
- Range
- Higher highs
- Lower lows
- Wedge
- Triangle
- Head and shoulders
Patterns can be useful, but they fail often. A pattern is not a guarantee. It only shows how price has behaved so far.
Crypto charts for beginners should focus on simple structure first: trend, support, resistance, volume, and time frame. Advanced patterns can come later.
How to Use Charts Before Buying Crypto
Before buying, use a chart to answer basic questions.
Ask yourself:
- Is the price in an uptrend, downtrend, or range?
- Is the coin near support or resistance?
- Did price recently pump?
- Is volume increasing or fading?
- Is the asset highly volatile?
- Am I buying because of analysis or emotion?
- Do I understand the project?
- What is my exit plan?
Charts should not be your only research tool. You should also understand the coin, market cap, token use case, exchange liquidity, and risk.
If you are buying for the first time, read how to buy crypto for beginners and best crypto exchange for beginners.
Crypto charts for beginners are best used as a decision aid, not as a gambling signal.
How to Use Charts Before Selling Crypto
Charts can also help when deciding whether to sell.
Ask yourself:
- Is price near resistance?
- Has volume weakened?
- Has the trend changed?
- Am I selling because of panic?
- Am I taking planned profits?
- Do I understand possible tax impact?
- Would a limit order make sense?
- Am I prepared if price keeps rising?
Selling can be emotional. Many beginners sell too early during normal volatility or too late after ignoring signs of weakness.
If you are planning a withdrawal, read how to cash out crypto and crypto taxes for beginners.
Common Beginner Chart Mistakes
Beginners often make the same mistakes when reading charts.
Avoid these errors:
- Using only the 1-minute chart
- Ignoring volume
- Buying after a huge pump
- Selling after a normal pullback
- Treating support as guaranteed
- Treating resistance as guaranteed
- Using too many indicators
- Trusting social media chart predictions
- Ignoring fees and slippage
- Trading without a plan
- Forgetting about security and taxes
Crypto charts for beginners should reduce emotional decisions, not create more confusion. If your chart has ten indicators and you still feel lost, simplify it.
Simple Beginner Chart Setup
A beginner chart setup can be simple.
Start with:
- Candlestick chart
- Daily time frame
- Volume bars
- 50-day moving average
- 200-day moving average
- One or two support zones
- One or two resistance zones
That is enough for most beginners.
You do not need every indicator. Too many indicators can give conflicting signals and create false confidence.
Crypto charts for beginners should help answer simple questions: Where has price been? What is the trend? Where might buyers or sellers react? Is volume confirming the move?
Chart Reading and Risk Management
Reading charts without risk management can be dangerous.
Before placing a trade, decide:
- How much you can afford to risk
- Whether you are investing or trading
- Where your invalidation point is
- Whether you will use a market or limit order
- How much fees may cost
- Whether taxes may apply
- Where you will store the crypto
A chart can help you plan, but it cannot protect you from poor position sizing, scams, or unsafe wallets.
Review crypto safety tips, crypto scams to avoid, and crypto wallet before moving larger amounts.
Should Beginners Trade From Charts?
Beginners can learn from charts, but active trading is risky. Many new crypto users lose money by overtrading, chasing pumps, using leverage, or trusting influencers.
If you are a beginner, consider using charts for education before using them for frequent trades.
A safer approach may be:
- Start with small amounts.
- Focus on major coins first.
- Avoid leverage.
- Learn support and resistance.
- Track your trades.
- Use limit orders when price control matters.
- Consider dollar-cost averaging crypto instead of trying to time every move.
- Keep records for taxes.
Crypto charts for beginners should build confidence slowly. The goal is not to become a day trader overnight.
Crypto Chart Checklist for Beginners
Use this checklist before making a chart-based decision.
| Question | Why It Matters |
|---|---|
| What time frame am I viewing? | Prevents short-term overreaction |
| Is the trend up, down, or sideways? | Gives market context |
| Where is support? | Shows possible buying interest |
| Where is resistance? | Shows possible selling interest |
| Is volume confirming the move? | Helps judge strength |
| Am I chasing a pump? | Reduces emotional buying |
| What order type will I use? | Helps avoid bad execution |
| What fees apply? | Shows real cost |
| Where will I store the asset? | Improves security |
| Did I record the trade? | Helps with taxes |
This checklist will not guarantee profits, but it can help beginners slow down and make more thoughtful decisions.
Final Thoughts: Crypto Charts for Beginners
Crypto charts for beginners are not about predicting the future perfectly. They are about understanding price history, market behavior, and risk.
A good beginner does not need dozens of indicators. Start with the basics: candlesticks, time frames, volume, trend, support, and resistance. Once those ideas make sense, moving averages and order books become easier to understand.
Charts can help you avoid chasing pumps, selling in panic, or making decisions based only on social media hype. But charts should be combined with research, security, tax awareness, and a clear plan.
The best way to learn crypto charts for beginners is to practice slowly. Look at major coins like Bitcoin and Ethereum. Compare daily and weekly charts. Watch how volume changes during big moves. Notice where price reacts.
Over time, charts can become less intimidating and more useful. They will not remove risk, but they can help you make calmer and more informed crypto decisions.
Crypto Charts for Beginners Frequently Asked Questions
What are crypto charts for beginners?
Crypto charts for beginners are visual tools that show how cryptocurrency prices move over time. They can display price candles, volume, time frames, support, resistance, and trend direction. Beginners use charts to understand market behavior before buying or selling. Charts do not guarantee profits, but they can help reduce emotional decisions and improve market awareness.
What is the easiest crypto chart to read?
The easiest crypto chart to read is usually a simple line chart because it shows price direction without too much detail. After that, beginners can move to candlestick charts, which show the open, close, high, and low for each period. A daily candlestick chart with volume is a good starting point for most new crypto users.
What do red and green candles mean in crypto?
A green candle usually means the crypto closed higher than it opened during the selected time period. A red candle usually means it closed lower than it opened. Each candle also shows the high and low price during that period. Beginners should avoid judging a market from one candle and instead look at trend, volume, and context.
What is support on a crypto chart?
Support is a price area where buyers have previously become active and helped stop the price from falling. It can act like a possible floor, but it is not guaranteed to hold. If price breaks below support with strong volume, the market may weaken. Beginners should treat support as a zone, not an exact number.
What is resistance on a crypto chart?
Resistance is a price area where sellers have previously become active and slowed or stopped price from rising. It can act like a possible ceiling. If price breaks above resistance with strong volume, traders may call it a breakout. Beginners should remember that resistance can fail, and no chart level guarantees future price movement.
Is volume important on crypto charts?
Yes, volume is important because it shows how much trading activity supports a price move. A price increase with strong volume may be more meaningful than a price increase with weak volume. Low volume can make moves easier to reverse. Beginners should watch volume along with price, support, resistance, and time frame.
Should beginners use indicators on crypto charts?
Beginners can use indicators, but they should start simple. Too many indicators can create confusion and false confidence. A basic setup may include candlesticks, volume, a daily time frame, and one or two moving averages. Beginners should understand price action and trend before adding advanced indicators like RSI, MACD, or Bollinger Bands.
Can crypto charts predict prices?
Crypto charts cannot predict prices with certainty. They show historical price behavior and help traders identify trends, support, resistance, volume, and possible market structure. Charts can improve decision-making, but they cannot remove risk. News, liquidity, exchange issues, regulations, and market sentiment can quickly change what a chart appears to show.