Crypto RSI: Beginner’s Guide to Reading Momentum
Crypto prices can move quickly. A coin may climb for several days, suddenly lose momentum, and reverse before a beginner understands what changed.
That is one reason traders use indicators such as crypto RSI.
RSI stands for Relative Strength Index. It is a momentum indicator designed to help traders measure the strength and speed of recent price movements.
Instead of simply showing whether a cryptocurrency went up or down, crypto RSI can suggest whether buying or selling momentum is becoming unusually strong.
For beginners, however, RSI is easy to misuse.
A reading above 70 does not automatically mean a cryptocurrency is about to crash. A reading below 30 does not automatically mean it is time to buy.
Learning what RSI actually measures—and combining it with price action, volume, support and resistance, and basic risk management—can make the indicator much more useful.
This beginner guide explains crypto RSI step by step without assuming you already understand technical analysis.
Quick Answer: What Is Crypto RSI?
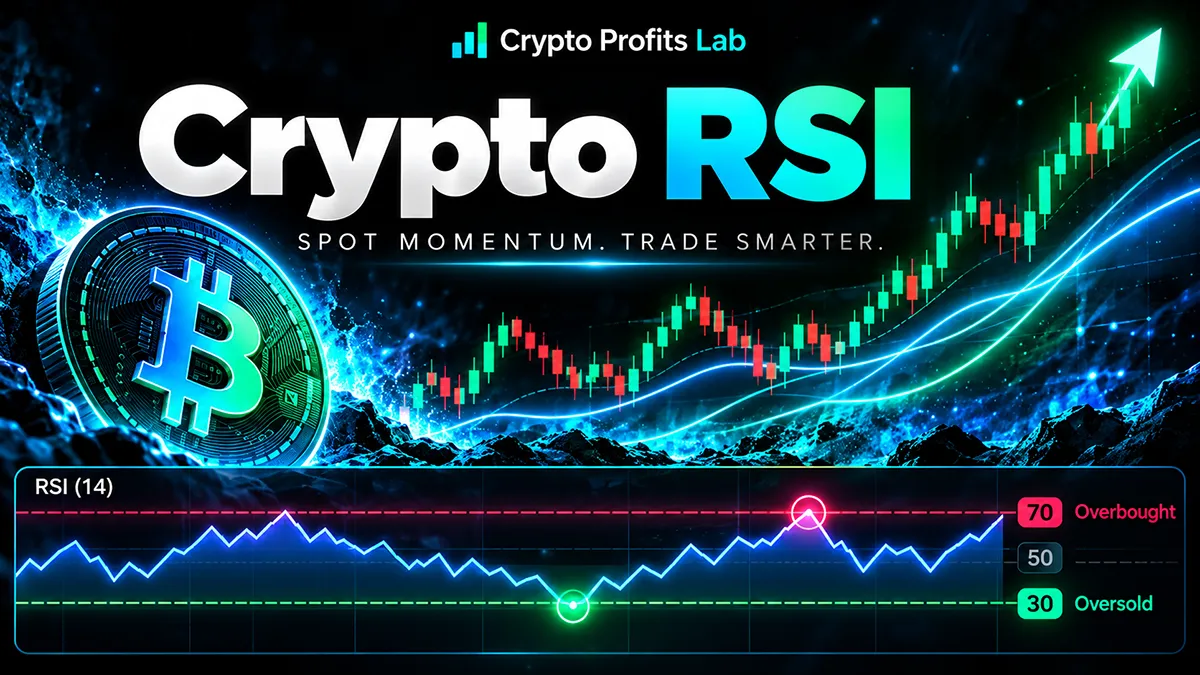
Crypto RSI is a momentum indicator that measures the strength of recent cryptocurrency price movements on a scale from 0 to 100.
Traditionally:
- An RSI above 70 is considered overbought.
- An RSI below 30 is considered oversold.
- An RSI near 50 represents more neutral momentum.
An overbought reading means recent upward price momentum has been unusually strong. It does not guarantee that the price will fall.
An oversold reading means recent downward momentum has been unusually strong. It does not guarantee that the price will rise.
RSI is most useful when combined with other information rather than used as a standalone buy or sell signal.
Key Takeaways
- Crypto RSI measures price momentum, not future price action.
- RSI moves between 0 and 100.
- The traditional overbought level is 70.
- The traditional oversold level is 30.
- A 14-period RSI is one of the most commonly used settings.
- An overbought cryptocurrency can continue rising.
- An oversold cryptocurrency can continue falling.
- RSI divergence can sometimes reveal weakening momentum.
- RSI often becomes more useful when combined with support, resistance, price trends, and trading volume.
- Beginners should never risk money solely because an RSI indicator produces a particular reading.
Crypto RSI Beginner Facts
| RSI Concept | Beginner Explanation |
|---|---|
| Indicator type | Momentum oscillator |
| RSI range | 0 to 100 |
| Traditional overbought level | Above 70 |
| Traditional oversold level | Below 30 |
| Neutral area | Around 50 |
| Common setting | 14 periods |
| Main purpose | Measure the strength and speed of recent price movements |
| Above 70 means | Strong recent upward momentum |
| Below 30 means | Strong recent downward momentum |
| Guaranteed reversal? | No |
| Best used alone? | No |
| Useful with | Trends, support/resistance, volume, and risk management |
What Is Crypto RSI?
RSI stands for Relative Strength Index.
Technical analyst J. Welles Wilder developed the indicator, which measures the relationship between recent upward price changes and recent downward price changes.
The result is converted into a number between 0 and 100.
You usually see the RSI displayed underneath a cryptocurrency’s main price chart as a separate line.
When the line rises, upward momentum is generally strengthening.
When the line falls, downward momentum is generally strengthening.
Traditional RSI analysis considers readings above 70 overbought and below 30 oversold.
For additional technical detail, Fidelity provides a useful educational explanation in its Relative Strength Index guide.
The important word in those definitions is momentum.
Crypto RSI does not tell you what a cryptocurrency is worth.
It does not evaluate a project’s technology, adoption, tokenomics, development team, or long-term future.
It simply analyzes recent price behavior.
That distinction matters.
A strong project can have a low RSI. A questionable token can have a high RSI. RSI is measuring price momentum, not investment quality.
If you are completely new to technical charts, our crypto charts for beginners guide provides a useful foundation before working with indicators.
How Does Crypto RSI Work?
You don’t need to calculate RSI manually because charting platforms do it automatically.
Still, understanding the basic idea helps.
RSI compares the size of recent price gains with the size of recent price losses.
If upward price moves have been much stronger than downward moves, the RSI rises.
If downward moves have been much stronger, the RSI falls.
The traditional calculation uses 14 periods.
A “period” depends on the chart you are viewing.
For example:
- On a daily chart, 14 periods means 14 daily candles.
- On a four-hour chart, 14 periods means 14 four-hour candles.
- On a one-hour chart, 14 periods means 14 one-hour candles.
This means crypto RSI can show different readings for the same cryptocurrency depending on the timeframe.
A coin might have an RSI of 75 on a one-hour chart while showing an RSI of only 55 on a daily chart.
Neither reading is necessarily wrong.
They are measuring momentum across different periods.
What Does an RSI Above 70 Mean?
An RSI above 70 is traditionally called overbought.
Beginners sometimes interpret “overbought” as another way of saying “too expensive.”
That is not exactly what it means.
An overbought reading tells you that upward momentum has been particularly strong compared with recent downward momentum.
Imagine a cryptocurrency trading at $10.
It begins attracting buyers and rises:
$10 → $10.50 → $11 → $12 → $13 → $14.
As those gains accumulate, its RSI may climb above 70.
This suggests buying momentum has been strong.
It does not mean $14 is the cryptocurrency’s fair value.
It also doesn’t guarantee the price will immediately return to $12 or $10.
Strong bull markets can remain overbought for surprisingly long periods.
That is why selling automatically every time crypto RSI crosses 70 can cause traders to exit successful trends too early.
What Does an RSI Below 30 Mean?
An RSI below 30 is traditionally considered oversold.
Again, beginners need to be careful with the terminology.
“Oversold” does not mean a cryptocurrency has become objectively cheap.
It means recent downward price momentum has been unusually strong.
Suppose a cryptocurrency falls:
$10 → $9.50 → $9 → $8 → $7.50 → $7.
Its RSI could fall below 30 as selling pressure increases.
That can sometimes occur near a short-term bottom.
But not always.
If serious negative news appears, a project fails, the broader crypto market crashes, or a token loses liquidity, an oversold cryptocurrency can continue dropping.
An RSI of 28 can become 22.
An RSI of 22 can become 15.
For that reason, beginners should avoid thinking:
“RSI is below 30, so the price has to go up.”
Nothing in financial markets has to happen simply because one indicator reaches a certain number.
Why the 50 Level Matters
Most beginner discussions focus entirely on 70 and 30.
The 50 level can also provide useful information.
Think of 50 as the center of the RSI scale.
When RSI spends substantial time above 50, upward momentum may be stronger.
When RSI spends substantial time below 50, downward momentum may be stronger.
For example, suppose a cryptocurrency has been rising steadily.
Its RSI moves between roughly 50 and 75 for several weeks.
Each temporary price decline pushes the indicator toward 50 before it starts rising again.
That behavior can suggest that bullish momentum remains intact even though the cryptocurrency periodically pulls back.
The opposite can happen during a sustained downtrend.
RSI may struggle to move meaningfully above 50 before falling again.
This is why experienced traders do more than just watch the 70 and 30 lines.
Step-by-Step: How to Read Crypto RSI
Let’s walk through a simple process a beginner can use.
Step 1: Look at the Overall Price Trend
Start with the actual cryptocurrency price.
Do not begin with RSI.
Ask:
- Is the price generally rising?
- Is it generally falling?
- Is it moving sideways?
- Has the trend recently changed?
The indicator should provide extra information about the chart—not replace the chart.
Step 2: Identify Important Support and Resistance
Next, look for areas where price has repeatedly stopped falling or stopped rising.
These areas are known as support and resistance.
Our crypto support and resistance guide explains how these levels work in greater detail.
Now RSI has context.
An oversold RSI reading near a well-established support area may be more interesting than an oversold reading occurring in the middle of nowhere.
Likewise, an overbought reading near major resistance may deserve more attention than a random 70 reading during a strong breakout.
Step 3: Check the RSI Reading
Now look at crypto RSI.
For a basic interpretation:
- Above 70 = strong upward momentum or traditionally overbought.
- 50 to 70 = generally positive momentum.
- Around 50 = more neutral.
- 30 to 50 = generally weaker momentum.
- Below 30 = strong downward momentum or traditionally oversold.
These ranges are guidelines, not rules.
Step 4: Check Trading Volume
Momentum becomes more meaningful when you understand how much trading activity supports a move.
A price breakout with strong volume may be more convincing than one on very little activity.
Our crypto trading volume guide explains why volume can help traders judge the strength of price moves.
For example, suppose price breaks through resistance while:
- volume increases,
- RSI rises above 60,
- and price remains above the broken resistance level.
Together, those factors may provide more useful information than an RSI reading alone.
Step 5: Wait for Confirmation
Beginners often feel pressure to act immediately.
That can lead to unnecessary mistakes.
Instead of buying simply because RSI reaches 30, you might wait to see whether the price actually stops falling.
Instead of selling simply because RSI reaches 70, you might watch whether the price begins losing support or forming lower highs.
Confirmation cannot eliminate risk.
It can, however, keep you from treating one indicator as a crystal ball.
What Is RSI Divergence?
Divergence happens when price and RSI begin moving differently.
This can suggest that the momentum behind a price move is changing.
There are two basic types beginners should understand.
Bullish RSI Divergence
Bullish divergence can occur when:
- The cryptocurrency price makes a lower low.
- RSI makes a higher low.
Imagine a coin falls from $20 to $15.
It rebounds to $17 and then falls again to $14.
Price has made a lower low because $14 is below $15.
But suppose crypto RSI was 24 during the first low and 31 during the second low.
RSI has made a higher low.
This means price has fallen farther, but RSI suggests downward momentum has weakened.
Some traders view this as an early warning that sellers may be losing strength.
It is not a guaranteed reversal signal.
Price could still continue lower.
Bearish RSI Divergence
Bearish divergence is the opposite.
It may occur when:
- Cryptocurrency price makes a higher high.
- RSI makes a lower high.
For example, price rises from $20 to $25, pulls back, and later climbs to $27.
That is a higher price high.
But suppose RSI reached 78 during the first rally and only 68 during the second.
Price made a stronger high while momentum made a weaker high.
That can indicate that upward momentum is slowing.
Again, divergence is a warning—not proof that a reversal is coming.
Crypto RSI and Breakouts
RSI can also provide useful context when price approaches an important breakout.
A breakout occurs when price moves beyond an established support or resistance area.
You can learn the full concept in our crypto breakout guide.
Imagine a cryptocurrency has struggled to move above $5 for several weeks.
It finally moves through $5 while:
- trading volume increases,
- RSI rises from 55 toward 65,
- and price stays above the former resistance level.
Those conditions may indicate growing momentum behind the breakout.
Now imagine price briefly moves above $5 while:
- trading volume stays weak,
- RSI momentum is fading,
- and price quickly moves back below $5.
That situation may deserve more caution.
The point is not that crypto RSI can tell you which breakout will succeed.
It can provide another piece of information to help you evaluate the move.
Crypto RSI in Strong Trends
One of the biggest beginner mistakes is assuming RSI must immediately reverse after crossing 70 or 30.
Strong trends can behave differently.
During a powerful cryptocurrency rally, RSI can remain above 70 while price continues climbing.
During a severe decline, RSI can remain below 30 while price continues falling.
This is especially important in crypto because the market can experience substantial crypto volatility.
Suppose XRP, Bitcoin, Ethereum, or another cryptocurrency receives significant positive news.
Buyers rush into the market.
The RSI reaches 72.
A beginner sells because the coin is “overbought.”
Price continues rising.
RSI reaches 78.
Price rises again.
RSI reaches 82.
The first overbought reading did not predict the top.
It simply identified unusually strong upward momentum.
That is why context matters more than a single number.
Which Crypto RSI Timeframe Should Beginners Use?
No single timeframe is best for everyone.
The appropriate timeframe depends on what you are trying to understand.
A very short-term trader might use five-minute, 15-minute, or hourly charts.
A longer-term trader or investor may care more about daily or weekly charts.
Beginners should generally understand that shorter timeframes create more signals and more noise.
The RSI can jump around rapidly on a short chart.
Daily charts tend to provide a broader view of momentum.
Before experimenting with many timeframes, choose one that matches your intended holding period and learn how RSI behaves there.
Jumping between multiple charts until you find the signal you want can introduce confirmation bias.
Should Beginners Change the RSI Settings?
Most beginners can start with the traditional 14-period setting.
You usually don’t need to customize the indicator right away.
Fewer periods make RSI react more quickly to recent price movement.
Increasing the number of periods generally makes it react more slowly.
Faster does not automatically mean better.
A more sensitive indicator may produce more signals, but it can also produce more false signals.
For someone still learning technical analysis, keeping crypto RSI simple is usually better than repeatedly changing settings to make historical charts look perfect.
7 Powerful Tips for Using Crypto RSI More Carefully
1. Never Treat 70 as an Automatic Sell
RSI above 70 means momentum is strong.
Price may reverse, consolidate, or continue rising.
Look at the complete market structure.
2. Never Treat 30 as an Automatic Buy
An oversold cryptocurrency can become more oversold.
Wait for signs that downward momentum is actually stabilizing.
3. Combine RSI With Support and Resistance
An RSI reading becomes more meaningful when it appears near an important price area.
4. Watch Volume
Strong trading volume can confirm a price move.
5. Compare RSI With Price
Watch for divergence and momentum shifts rather than focusing entirely on one RSI number.
6. Use Consistent Timeframes
Avoid constantly changing charts to find the signal you want.
7. Protect Every Trade With Risk Management
No technical indicator works every time.
That makes position size, stop-loss planning, and risk/reward analysis essential.
Crypto RSI and Risk Management
Even a well-planned RSI trade can fail.
That should be expected.
Technical indicators deal with probabilities, not certainty.
Before entering a trade, determine how much money you are willing to lose if the idea is wrong.
Our crypto position sizing guide explains how traders can limit the amount of their portfolio exposed to one trade.
A crypto stop loss can also help establish an exit level before emotion takes over.
Finally, compare your potential loss with the potential reward.
Our crypto risk reward ratio guide explains that concept step by step.
Consider two beginners.
Trader A sees an oversold RSI reading and immediately buys $5,000 worth of a cryptocurrency without an exit plan.
Trader B notices the same reading but first evaluates support, trend, volume, position size, stop placement, and potential reward.
Both traders can still lose.
But Trader B has built risk management into the decision.
That difference is far more important than finding a supposedly perfect indicator.
Common Crypto RSI Mistakes Beginners Make
Buying Every Oversold Reading
Below 30 is not a guaranteed bottom.
Strong downtrends can continue much longer than expected.
Selling Every Overbought Reading
Above 70 is not a guaranteed top.
Strong rallies can remain overbought.
Ignoring the Price Chart
The indicator should supplement price analysis, not replace it.
Ignoring the Larger Trend
An oversold signal in a major downtrend can behave very differently from one during a temporary pullback in an uptrend.
Using Too Many Indicators
Beginners sometimes cover their charts with RSI, MACD, moving averages, Bollinger Bands, Stochastics, Fibonacci levels, and multiple other tools.
More indicators do not automatically provide more clarity.
Often they create confusion.
Changing Settings After Every Loss
No RSI configuration can eliminate losing trades.
Constantly adjusting settings to fit past price movements can create a strategy that looks impressive historically but performs poorly in real conditions.
Trading Without Risk Controls
Even the best-looking setup can fail.
Risk management should always come before predictions.
Is Crypto RSI a Buy or Sell Signal?
Not by itself.
RSI is better understood as a momentum tool.
A trader might use it to ask questions such as:
- Is upward momentum becoming unusually strong?
- Is downward momentum weakening?
- Is price making a new high while RSI fails to confirm it?
- Is RSI strengthening during a breakout?
- Is a pullback occurring while the larger trend remains strong?
Those are more useful questions than simply asking:
“Is RSI above 70?”
The goal is to gather evidence.
Can You Use RSI for Spot Trading?
Yes.
Crypto RSI can be used when analyzing spot trading in crypto, where you buy and sell the actual cryptocurrency rather than using leveraged derivatives.
The same basic principles apply.
RSI can provide information about momentum, but it doesn’t determine whether you should trade.
Beginners should remember that spot trading still involves significant risk because cryptocurrency prices can fall sharply.
Not using leverage does not eliminate market risk.
Safety and Risk Warning
Cryptocurrency trading is highly speculative.
Crypto RSI does not guarantee profitable trades and cannot predict unexpected events such as:
- exchange problems,
- regulatory announcements,
- security breaches,
- project failures,
- token unlocks,
- major liquidations,
- economic news,
- sudden changes in market sentiment,
- or unexpected buying and selling by large market participants.
Technical indicators rely on historical price data.
Future price movements can behave differently.
Never invest money solely because an indicator appears bullish or bearish.
Beginners should use small position sizes while learning and avoid risking money they cannot afford to lose.
Be particularly cautious with leverage.
Leverage can magnify both gains and losses, and a trade that would cause a manageable loss in spot markets can potentially result in liquidation when borrowed exposure is involved.
Final Thoughts
Crypto RSI is one of the simplest technical indicators for beginners to recognize, but using it correctly requires more than watching the 70 and 30 lines.
RSI measures momentum.
It can show whether recent buying or selling pressure has become unusually strong, identify possible divergences between price and momentum, and add context around support, resistance, trends, and breakouts.
It cannot tell you with certainty where price goes next.
That limitation is important.
A cleaner approach is to treat RSI as one piece of a larger decision-making process.
Start with the price chart.
Identify the trend.
Mark important support and resistance levels.
Check volume.
Then use RSI to evaluate momentum.
Finally, decide how much risk you are willing to take before entering any trade.
Crypto Profits Lab is designed to make concepts like these easier for beginners to understand without turning every chart into a wall of confusing indicators.
Learn one concept at a time.
Understand what the tool can—and cannot—tell you.
Then build on that foundation.
That approach may not feel as exciting as chasing instant buy-and-sell signals, but it is a much stronger way to learn crypto.
Frequently Asked Questions About Crypto RSI
What is crypto RSI?
Crypto RSI is the Relative Strength Index applied to cryptocurrency price data. It is a momentum indicator that ranges from 0 to 100 and compares recent price gains with recent losses. Traders commonly use RSI to identify unusually strong buying or selling momentum, possible momentum changes, and potential divergences between an asset’s price and its underlying momentum.
What does an RSI of 70 mean in crypto?
An RSI of 70 means a cryptocurrency has experienced relatively strong upward momentum over the indicator’s measurement period. Traditionally, readings above 70 are described as overbought. However, overbought does not mean the price must immediately decline. During strong bullish trends, RSI can stay above 70 while a cryptocurrency keeps rising.
What does an RSI below 30 mean in crypto?
An RSI below 30 traditionally indicates oversold conditions, meaning recent downward price momentum has been unusually strong. It can sometimes appear near a price bottom, but it doesn’t guarantee a buy signal. A cryptocurrency in a strong downtrend can stay below 30 or keep falling even after the indicator enters oversold territory.
Is crypto RSI accurate?
Crypto RSI measures price momentum based on its mathematical formula, but it can’t predict every future price move. False signals occur, and markets can remain overbought or oversold for extended periods. RSI is generally more useful when traders combine it with price trends, support and resistance, volume, and sensible risk management rather than relying on RSI alone.
What is the best RSI setting for crypto?
The traditional 14-period RSI is a sensible starting point for most beginners and remains widely used. Shorter settings react faster to price changes but can produce more noise, while longer settings react more slowly. No single crypto RSI setting is universally best; the right configuration depends on the market, trading timeframe, strategy, and how sensitive a trader wants to be.
Is RSI below 30 a good time to buy crypto?
An RSI below 30 can indicate strong selling pressure, but it does not automatically make a cryptocurrency a good investment or trade. Price may continue falling because of a larger downtrend, negative news, poor liquidity, or broader market weakness. Beginners should review the trend, support levels, trading volume, project risk, and their own risk tolerance before deciding.
Can crypto RSI predict a reversal?
Crypto RSI can help identify conditions that sometimes precede price reversals, especially extreme readings or bullish and bearish divergences. However, it cannot reliably predict every reversal. A divergence may continue for a long time before price changes direction, and some apparent reversal signals fail completely. RSI should therefore be treated as supporting evidence rather than a prediction tool.
Should beginners use RSI for crypto trading?
Beginners can use RSI because its 0–100 scale is relatively easy to understand, but they should learn its limitations before trading with it. The most important lesson is that RSI does not provide guaranteed buy or sell signals. Beginners are better served by combining RSI with basic chart reading, support and resistance, trading volume, position sizing, and clearly defined risk management.