Crypto Support and Resistance: 7 Smart, Powerful Tips

Crypto charts can look complicated at first. One of the simplest ways to bring structure to price movements is to learn crypto support and resistance levels.
These are areas where buyers or sellers have reacted before. Support is where falling prices may slow or bounce as buying interest increases. Resistance is where rising prices may slow or reverse as selling pressure increases.
Crypto support and resistance cannot predict the future. It gives beginners a clearer way to organize a chart and plan entries, exits, stops, and targets.
Quick Answer
Crypto support and resistance refer to price levels on a cryptocurrency chart where price has previously struggled to move lower or higher.
Support is usually below the current price. It represents an area where buying demand may become strong enough to slow a decline or create a bounce.
Resistance is usually above the current price. It represents an area where selling pressure may become strong enough to slow a rally or push price lower.
For example, if Bitcoin repeatedly falls toward $90,000 and rebounds, traders may begin watching that area as support. If it repeatedly rises toward $100,000 and pulls back, traders may treat that area as resistance.
These levels are better viewed as zones rather than exact prices. They can break, fail, move, or reverse roles.
Key Takeaways
- Support is a price area where downward movement may slow or reverse.
- Resistance is a price area where upward movement may slow or reverse.
- Crypto support and resistance work best as zones, not razor-thin lines.
- Previous swing highs and swing lows are common places to look for levels.
- Repeated reactions can make an area more noticeable to traders, but no level is guaranteed to hold.
- Broken resistance may later act as support, while broken support may later act as resistance.
- Volume can provide extra context when price approaches or breaks an important area.
- Support and resistance can help with stop-loss placement, take-profit planning, risk/reward analysis, and position sizing.
- Crypto volatility can create false breakouts, so beginners should avoid treating every move through a level as confirmation.
Crypto Support and Resistance Beginner Facts
| Term | Beginner Meaning |
|---|---|
| Support | A price area where buying interest may slow or stop a decline |
| Resistance | A price area where selling interest may slow or stop a rise |
| Zone | A range of prices rather than one exact line |
| Swing low | A local low where price fell and then moved higher |
| Swing high | A local high where price rose and then moved lower |
| Breakout | Price moves beyond a watched support or resistance area |
| False breakout | Price briefly moves beyond a level and then quickly returns |
| Role reversal | Old resistance becomes support, or old support becomes resistance |
| Volume | The amount of an asset traded during a period |
| Timeframe | The amount of time represented by each chart candle |
What Is Crypto Support and Resistance?
Crypto support and resistance are basic forms of chart analysis used to identify price levels where buying and selling pressure have previously changed the market’s direction or speed.
Imagine price moving inside a room.
The floor represents support. When price falls toward the floor, it may bounce upward.
The ceiling represents resistance. When price rises toward the ceiling, it may struggle to move higher.
The analogy is useful, but real markets are less precise. Support does not guarantee a bounce, and resistance does not guarantee a decline.
A support area can break during heavy selling. A resistance area can break when buyers become more aggressive. That is why experienced traders usually think in probabilities rather than certainties.
For a public technical-analysis explanation of the same concept, see CME Group’s Support and Resistance lesson.
If you are still learning chart basics, start with our crypto charts for beginners guide. It explains candlesticks, timeframes, and other chart features, making this article easier to follow.
Why Support and Resistance Forms
Support and resistance can form because many market participants notice the same price areas.
If a cryptocurrency repeatedly falls near $10 and buyers step in, traders may remember that area as a place where demand appeared. If the price returns later, new buying interest may appear again.
Resistance works the other way. If price repeatedly approaches $12 and stalls, traders may begin watching that level for signs of selling pressure.
Crypto support and resistance can become more visible because many people watch the same zones, but no level is guaranteed. News, liquidity changes, large orders, and shifts in sentiment can push price through a previously important area.
Why Zones Are Better Than Exact Lines
One of the most common beginner mistakes is drawing support at exactly $2.3000 and assuming price must react at that precise number.
Markets rarely behave that neatly.
One trader may buy at $2.29. Another may buy at $2.31. A large order could appear at $2.28. Price may briefly move below the level before recovering.
For that reason, many traders mark a support zone, such as $2.27 to $2.32, rather than a single line.
The same idea applies to resistance.
A resistance zone might span from $2.72 to $2.78 rather than sit exactly at $2.75.
Using zones makes crypto support and resistance easier to apply without overreacting to minor price movements that don’t change the broader chart structure.
Step by Step: How to Find Crypto Support and Resistance
Step 1: Choose a Timeframe
Start by choosing the chart timeframe that matches what you are trying to understand.
A daily chart shows larger price structure. A four-hour chart shows more detail. A five-minute chart contains much more short-term noise.
Beginners often find higher timeframes easier because there are fewer small moves competing for attention.
Crypto support and resistance can appear on every timeframe, but a level visible on a daily or weekly chart may attract more attention than a minor level that exists only on a very short-term chart.
Step 2: Zoom Out
Do not begin by staring only at the most recent candles.
Zoom out enough to see where price has previously changed direction.
Look for obvious highs, obvious lows, and areas where price spent time moving sideways.
The goal is not to mark every reaction. You are trying to find the areas that stand out.
Step 3: Mark Important Swing Lows
A swing low is a local low where the price stops falling and begins moving higher.
Look for locations where this happened more than once.
If several declines stopped in roughly the same area, that can help identify possible support.
You do not need three perfect touches at exactly the same price. The important part is repeated reaction within a similar zone.
Step 4: Mark Important Swing Highs
Next, look for local highs where the price stopped rising and started moving lower.
Repeated highs in a similar area can help identify resistance.
For example, if price rallies toward $50 several times but repeatedly pulls back between $49 and $51, that entire area may be more useful than a single $50 line.
Step 5: Turn Lines Into Zones
Once you find the major swing areas, widen them slightly into zones.
Keep the zones narrow enough to be meaningful but wide enough to reflect normal price variation.
There is no universal zone width because a highly volatile cryptocurrency can move much more than a stable, liquid asset over the same period.
Our crypto volatility guide explains why different assets can require different expectations for normal price movement.
Step 6: Look for Repeated Reactions
Now count how price behaved around the area.
Did it bounce several times?
Did rallies repeatedly fail there?
Did the market pause there before a strong move?
Repeated reactions can make crypto support and resistance easier to recognize.
But do not assume that a level becomes unbreakable because it has worked before. Every additional test can produce a new outcome.
Step 7: Add Volume for Context
Price is the main information, but volume can add context.
A breakout on strong trading volume may attract more attention than a small move through resistance during quiet trading.
Likewise, a sharp rejection at a support zone on increasing volume may indicate that many market participants became active around that level.
You can learn the basics of crypto trading volume in our guide.
Volume is confirmation, not a guarantee.
Role Reversal: When Resistance Becomes Support
One of the most useful ideas in crypto support and resistance is role reversal.
Suppose a cryptocurrency repeatedly fails to move above $100.
The $100 area is resistance.
Eventually, price breaks above $100 and rises to $110. Later, price falls back toward $100.
Traders may now watch the old resistance area to see whether it becomes support.
Why can this happen?
Traders who sold near $100 may change their view after the breakout. People who missed the move may wait to buy on a pullback. Existing holders may also see $100 as an attractive level to add at.
The reverse can happen when support breaks.
An old support zone may later become resistance as traders who bought there try to exit when price returns.
Role reversal is common enough to watch, but it is not guaranteed.
Breakouts and False Breakouts
A breakout occurs when price moves beyond a support or resistance zone.
If price rises above resistance, traders may describe it as a bullish breakout.
If the price falls below support, it may be described as a bearish breakdown.
The challenge is that crypto markets frequently produce false breakouts.
Price may move above resistance for a short period, attract buyers, and then fall back below the level. The same thing can happen below support.
This is one reason beginners should be careful about reacting to the first candle that crosses a level.
Some traders wait for a candle to close beyond the area. Others look for higher volume, a retest of the broken level, or additional confirmation.
No confirmation method eliminates false signals.
Using Support and Resistance With Stop Losses
Crypto support and resistance can help add structure to a stop-loss decision.
Suppose a trader buys after price bounces from a support zone.
Instead of placing a stop at a random percentage, the trader might decide the trade idea is no longer valid if price clearly falls below that zone.
That does not mean the stop should always sit directly beneath support. Crypto volatility and normal price noise can trigger very tight stops.
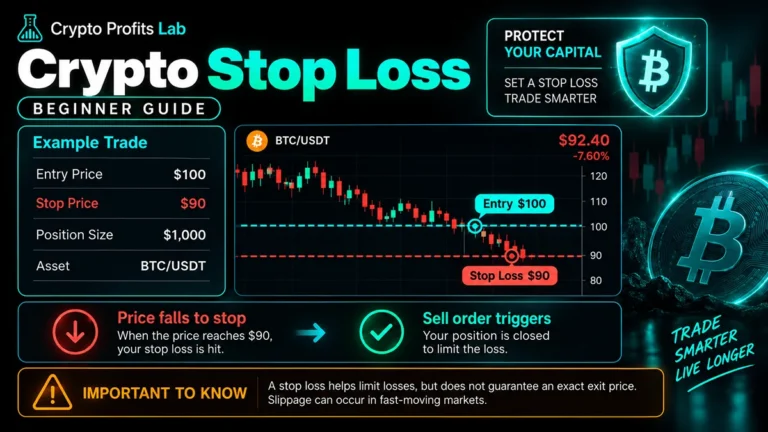
Our crypto stop loss guide explains how stop orders work and why execution can differ from the trigger price.
The key point is that the stop should have a logical reason.
Using Support and Resistance With Take Profit
Resistance can also provide context for a profit target.
Suppose you buy near support and the next major resistance area is significantly higher.
You might use that resistance zone as one possible place to evaluate taking profit.
Similarly, a trader in a declining market may watch support as a potential target.
Our crypto take profit guide explains fixed targets, partial exits, and other basic exit-planning concepts.
Support or resistance should not be used blindly. Price can stop before the level, move straight through it, or reverse unexpectedly.
Support and Resistance With Risk Reward Ratio
Once you have a possible entry, stop, and target, you can compare the planned downside with the planned upside.
That is where the crypto risk reward ratio becomes useful.
For example:
- Planned entry: $50
- Support zone: around $48
- Possible stop: $47
- Resistance target: $56
The planned risk from $50 to $47 is $3.
The possible reward from $50 to $56 is $6.
That creates a simplified 1:2 risk/reward relationship before fees, spread, and slippage.
Crypto support and resistance can therefore provide the chart structure, while risk/reward helps measure whether the proposed trade makes sense mathematically.
Support and Resistance With Position Sizing
Knowing where the stop belongs is only part of the plan.
You also need to decide how much capital to place in the trade.
Our crypto position sizing guide explains how traders can connect account risk with the distance between entry and stop.
This matters because two trades using the same support zone can create very different financial outcomes if one position is ten times larger than the other.
A good-looking chart level does not make an oversized position safe.
7 Smart Rules for Using Crypto Support and Resistance
1. Mark Zones, Not Perfect Lines
Give price room to move around an area.
Exact lines can create false confidence.
2. Prioritize Obvious Levels
If you need to draw twenty lines to explain the chart, the chart may be too cluttered.
Start with the clearest highs and lows.
3. Use More Than One Touch
One reaction can be random.
Several reactions in a similar area can make a level more meaningful to watch.
4. Respect the Timeframe
A level on a five-minute chart and a level on a weekly chart are not the same type of information.
Know which timeframe your plan is based on.
5. Watch Volume Around Breakouts
Volume can help show whether participation increased when price crossed a level.
It is additional evidence, not proof.
6. Plan Before Price Reaches the Zone
Decide what you will do before emotion takes over.
Will you wait for a bounce? A candle close? A retest? Will you do nothing if the setup is unclear?
7. Accept That Levels Fail
Every support zone can break.
Every resistance zone can break.
Crypto support and resistance are useful because they give structure to uncertainty, not because they remove uncertainty.
Common Beginner Mistakes
Drawing Too Many Levels
A chart covered with lines becomes difficult to use.
Focus on the most obvious areas.
Treating Levels as Exact Prices
Support and resistance are usually better understood as zones.
Assuming a Level Must Hold
A past bounce does not guarantee another bounce.
Buying Immediately at Support
Price can move straight through support. Waiting for confirmation is one possible way traders try to reduce premature entries, although confirmation can also come late.
Selling Immediately at Resistance
Resistance can break just as easily as support.
Ignoring the Bigger Trend
A small support level may be less important during a strong market-wide decline.
Ignoring Liquidity, Spread, and Slippage
Even a good chart setup can produce a poor execution.
Review crypto spread and crypto slippage if you are unfamiliar with these costs.
Changing Levels to Fit What You Want to See
Do not move a line simply because you want a trade to work.
Crypto support and resistance should guide the analysis, not the outcome you hope to see.
Safety and Risk Considerations
Crypto support and resistance are not a guarantee of where price will stop or reverse.
Crypto markets can move sharply due to news, liquidations, large orders, regulatory developments, exchange issues, or sudden shifts in market sentiment.
A support zone can fail within seconds.
A resistance zone can disappear during a strong rally.
Stop orders can also fill at worse-than-expected prices during fast markets. Low liquidity can make execution even less predictable.
Beginners should avoid risking money needed for bills or emergencies. If you are practicing chart analysis, consider paper examples or very small positions while learning how your exchange works.
If you trade through a centralized exchange, protect the account with a unique password and crypto 2FA.
Chart analysis helps organize decisions. It does not remove market risk.
A Simple Support and Resistance Checklist
Before acting on a level, ask:
- Is this a clear zone or am I forcing a line onto the chart?
- Has price reacted here more than once?
- What timeframe am I using?
- Is the market trending or ranging?
- Is the level support, resistance, or a possible role-reversal zone?
- What does volume look like?
- Where would my trade idea be invalid?
- Where is the next major level?
- What is my planned risk/reward?
- Is my position size reasonable?
- Have I considered fees, spread, and slippage?
- What will I do if price breaks the level?
If those questions do not have clear answers, waiting can be a valid decision.
Crypto Support and Resistance Frequently Asked Questions
What Is Crypto Support and Resistance?
Crypto support and resistance refer to price zones where a cryptocurrency has previously experienced increased buying or selling pressure. Support is generally below the current price and may slow a decline, while resistance is generally above the current price and may slow a rally. These areas are identified from previous chart reactions. They are not guaranteed barriers, and price can break through either one at any time.
How Do I Find Support and Resistance in Crypto?
Start by zooming out on a price chart and marking obvious swing lows and swing highs. Look for areas where price reversed, bounced, or stalled more than once. Treat those prices as zones instead of exact lines. Higher-timeframe levels can be easier for beginners to recognize. Volume and the broader market trend can provide additional context, but no indicator can confirm a level with certainty.
Is Support and Resistance Accurate in Crypto?
Support and resistance can be useful for organizing chart analysis, but they are not perfectly accurate. A level may hold several times and then break without warning. Crypto volatility, news, liquidity, and large orders can all quickly change price behavior. The concept is most useful for identifying areas of interest and planning for risk rather than for predicting that a specific price must hold.
What Happens When Crypto Breaks Resistance?
When price moves above a resistance zone, traders may call it a breakout. Some traders then watch the old resistance area to see whether it becomes new support. However, the breakout can fail, and price may move back below the zone. Volume, candle closes, retests, and broader trend conditions can provide additional context, but none of them guarantees that the breakout will continue.
What Happens When Crypto Breaks Support?
A break below support can signal that selling pressure has overwhelmed buying interest around that area. Traders may then watch the old support zone as possible resistance if price later rebounds. The move can also be a false breakdown, where price quickly recovers above support. Because these reversals happen, beginners should avoid assuming that the first move below a level confirms a lasting trend change.
Should I Buy Crypto Every Time It Reaches Support?
No. A support zone is an area to watch, not an automatic buy signal. Price can bounce, move sideways, or break directly through support. Before entering a trade, consider the larger trend, volatility, volume, stop placement, risk/reward, and position size. Some traders wait for evidence of a bounce or other confirmation, but confirmation also cannot guarantee a successful trade.
Are Support and Resistance Better as Lines or Zones?
Zones are usually more practical because markets rarely reverse at one exact price. Orders are spread across different prices, and volatile crypto assets can temporarily move above or below a level before reversing. A zone allows for that normal variation. Thin lines can still be useful as visual references, but beginners should avoid assuming that a few cents or dollars beyond a line automatically means the level failed.
Does Crypto Support and Resistance Work on All Timeframes?
Yes, support and resistance can appear on very short-term charts as well as daily, weekly, and monthly charts. However, levels from different timeframes serve different purposes. A five-minute level may matter to a short-term trader while being irrelevant to a long-term investor. Beginners should choose a timeframe that matches their goal and avoid mixing unrelated levels from many timeframes on one chart.
Final Thoughts
Crypto support and resistance is one of the simplest chart concepts a beginner can learn, but it is never a guarantee.
Support highlights areas where buying interest has appeared. Resistance highlights areas where selling interest has appeared. The most useful levels are often zones built from obvious previous reactions rather than perfect lines.
Those zones can help organize entries, stop losses, profit targets, risk/reward, and position sizing.
The goal is not to predict every bounce or breakout. It is to create a clearer plan before money is at risk.
Crypto Profits Lab makes crypto support and resistance easier to understand without unnecessary jargon or false promises. Keep your chart clean, focus on obvious levels, and remember that every level can eventually break.